

It was a ride down for the majors against the USD as risk aversion set in upon developments with the Syria crisis, which at the same time, saw the USD regain some strength as September brings the US tapering closer into view. In other markets, Gold fell alongside the American indexes who also retreated in response to the Syria crisis, ending the week lower. This week starts a little light with the US and Canada enjoying their Labour Day holiday ahead of what appears to be quite a busy week ahead. There are a few important figures around interest rates, GDP and inflation due out in the next few days, with NFP figures as the grand finale. We may very well be in for a very interesting week.
GBPUSD
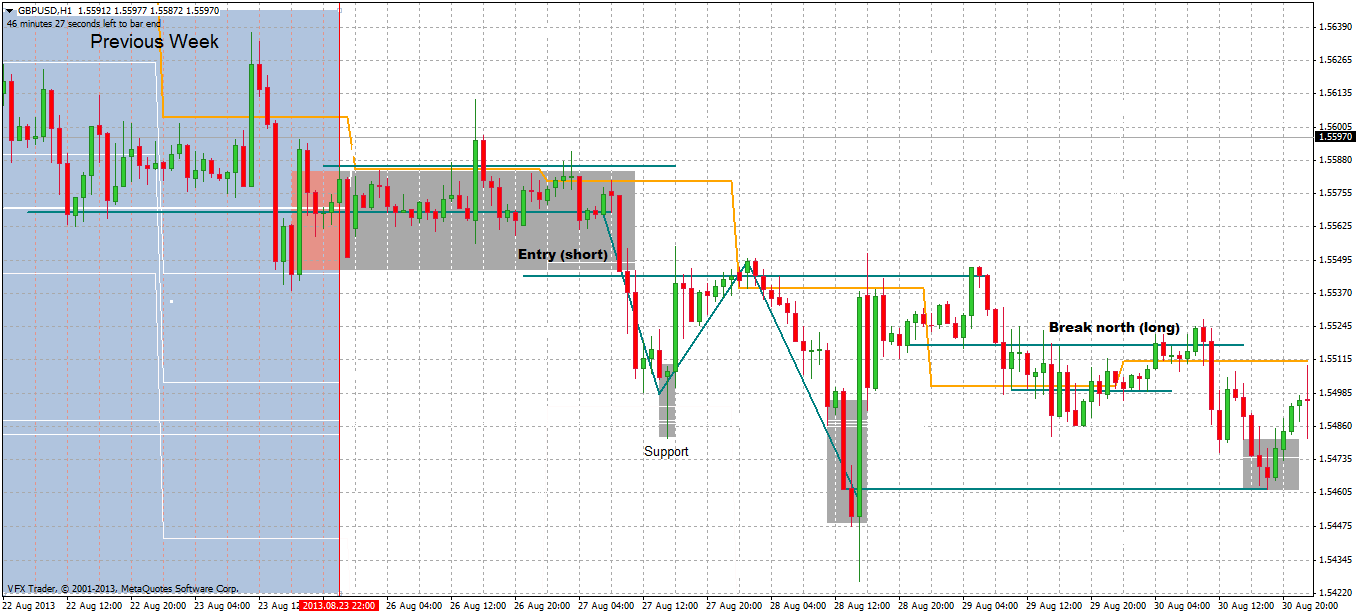
GU commenced the week opening at 155621 followed by a tight consolidation lasting over both the Asia and London sessions. However it was not long before the New York session made the move taking GU first to a low of 155643, followed by an immediate retracement to back north to a high of 156112 (just above R3). Resistance upon a breach of 156 then brought GU back to around 155729, in line with the low of its previous range. The next day saw GU exert effort once more towards 156 (high of 155875) which rejected for the second time, taking GU even lower to 155454, followed by an extended fall to 155044.
Upon breaking 155, GU resumed south, reaching a new low of 154813 which found support in the form of a pinbar. This then prompted a move back higher first towards 155225 (61%) and then to 155506, re-testing the 76% level. Finding resistance at this level, GU broke from this level in a steady decline, reaching 154478. The 28th Aug saw an attempt to follow through with a bearish continuation, however upon its approach towards 1544000, buyers stepped in at 154264, propelling a surge of bullish momentum that reversed direction back north to a high of 155379 in one bold move. Fuelled by this renewed optimism, any bearish attempts were now refuted, leaving GU to maintain its position wedged between the 61% -76% levels.
This was short lived however, as rejection set in, prompting GU to decline lower back to 154975(23%). The 29th August saw price holdhere as support, retracing slightly higher back above 155 but without much gust while it was still capped by the 155225 (61%). However upon reaching a high of 155272, GU surrendered, falling back to a low of 154618, just under DS1. Forming support, GU then made its move back north in a small bullish ladder to 154975(23%). One last attempt to re-test DP (15511) saw GU reach 155093 but unable to sustain, it fell back down, closing at 154959(23%).
The week was rather light with data however it did present at least one important event with a speech to UK parliament addressing Monetary Policy and the BOE's outlook on the Bristish economy. In this speech Mark Carney outlined the concerns of the general public while re-iterating the MPC’s commitment to their economic recovery. Touching upon familiar territory, "forward guidance" was once again the focal point with an emphasis on the 7% unemployment rate target being perceived as only a threshold for when the MPC will consider “reassessing the state of the economy and the appropriate stance of monetary policy". It was also mentioned that that the MPC did not see this target achievable any time soon given the uncertainty with economic forecasts over the next couple of years. As such, interest rates were not expected to rise in the near future.
Although the speech was more of a re-iteration of the plan already presented with a touch of a dovish tone, the market reacted positively, taking GU in a bull run back north from the current lows. Hence, stumping any further movement towards a continuation lower. Economic data did very little to sway sentiment in either direction, however the GBP did realease a couple of positive figures during the week such as Mortgage Approvals (Jul) which came in at 60.624K vs. 59.000K, Consumer Credit resulting in €0.6B vs. £0.4B and Net Lending to Individuals which saw an improvement from£1.1B to £1.3B.
Moving to the charts, it can be seen that the break of the top consolidation formed last week opened the path to test lower once the range was broken.The bearish 3 candle move from 155743 to 0155044 following the break, represents GU's strength which price break through DR1 straight to DP, where it momentarily rested. The pinbar (low of 154813) printed on the 27th August provided the signal to test-higher which upon reaching 100% rejected accordingly which in itself suggested that a bearish sentiment was in play and that a re-test of DP would determine whether GU would aim for lower targets. The rejection of the 3 pinbars holding at DP as support, paved the way for the extension of the fall which saw GU reach DS1 and then further to DS2. Although potential for a continuation was presented in the sell off from 1.54975 (23%) to 154440 (DS2), the rejection of the final extension to 154264 eliminated this as a prospect once price reversed higher closing at 155379.
However the most interesting thing to note in the charts is the sharp surge back above DP
which despite the build up of momentum, failed to follow through in continued reversal.Therefore the market reaction to this event remains a little questionable. This is especially case with the presented hesitation following the bullish breakout, which saw GU remain uneventful for the remainder of week, well positioned near the lows. Secondly, as uncertainty looms regarding the situation in Syria and US tapering starts to come into view, any positive advancements in the USD will see GU continue its trek down towards 154 and beyond.
With GU sitting just under 154975 (23%), the next level to be tested is 15507 (DP). A break above this level will expose GU to a run up to 155118 (76%) and containment within this level will see GU move back south. However, extending above this level, the next targets sit at 15540 (DR1), followed by 155862 (DR2) and finally 156260 (DR3). Alternatively, a break below will see 154536 (DS1), followed by 154138 (DS2) and then 1543679(DS3).
EURUSD

Opening at 133840, EU started the week extending the consolidation formed from the last New York session. Moving consistently within this range, early attempts to break lower eventually led to EU moving slightly lower to around 133680 until the end of the trading day. This continued until the 27th August, when EU travelled back towards 133700 followed by another re-attempt back towards 134, forming a pinbar upon reaching 133902.
Once again upon the approach of the 134 level, a surge of selling saw EU break lower taking price from a high of 133863 to a low of 133219. Settling now at the lows, EU waited briefly for direction before a sudden thrust of bullish momentum reversed the direction back to a high of 133971 closing at 133839. This reluctance to fall was represented by price sustained now at the highs in a tight range between 133790 – 133979 that continued into the 28th Aug. However, this did not last much longer when the rane finally broke leading EU down to 133360 just under the previous day’s high (133425). Finding brief support at this level, another attempt higher was made reaching 133727. However this was followed with sellers who upon spotting a short opportunity took advantage, printing a significant bearish marobuzu (low of 133047), which finally retraced back to the 133133 (76%).
EU consolidated within this top range of 133133 – 133425 (76% and 100%) in preparation for a move lower which saw EU descend down in a steep bearish ladder back below 133 resting at 132670 (DP). This then led to a gradual move lower, breaking 132480(23%) and reaching a low of 132188 (previous day’s low). From here, EU remained at the lows in consolidation before retracing back to 23% where it sustained until the 30th August. Now trading at the lower end of recent price action, EU finally broke lower to 131727 breaching (DS1). Supported at this level, EU retraced back towards 132188 (previous day’s low), closing the New York session at 132179.
In line with risk aversion and other factors, EU's price movement has now moved away from the excitement experienced in the previous week upon the news that Europe was stabilising and now out of a recession. It does seem that the move reflected preliminary optimism as sellers still remained poised at the high levels, containing EU from progessing above 134531 (recent high). Instead these sell actions at the higher levels, have confirmed tops,which have been more helpful in contributing to a clearer picture of market sentiment and potential direction in the short-term. Much like the other advanced economies, economic data will be key in assertaining a true indication of their economic position. Therefore, continued reliance on positive economic data figures are still in focus as Europe continues to look for signs of improvement.
Much of EU’s move in the last week has been largely contributed by the global concerns surrounding Syria which has had a negative effect on the financial markets along with the political uncertainty in Italy. However, interesting observations in regards to market sentiment can be ascertained by its reaction to its own domestic data. When positive figures start to have little or no effect, this in itself may suggest signs of exhaustion finally starting to set in as we retrace from the highs with lower targets now within view.
Looking at the 4 hour chart, a top on the 20th August is now clearly identified. The high of 134514 achieved by a gallant effort to reach highs and touch 134. Until price breaks above 134500, uncertainty in regards to pushing EU higher and cap EU within the current range. This is reflected in the formation of the inverted pinbar, that if respected will see EU contained within this high and propell south holding a different agenda in hand.
Looking at the 4 hour chart, a top on the 20th August is now clearly identified. The high of 134514 achieved by a gallant effort to reach highs and touch 134. Until price breaks above 134500, uncertainty in regards to pushing EU higher and cap EU within the current range. This is reflected in the formation of the inverted pinbar, that if respected will see EU contained within this high and propell south holding a different agenda in hand.
In the immediate view, what we will need to see is the next movement following the pinbar supporting DS1. A move higher will see 132450 (DP) as the next containment level, however moving further north will set sights upon 13316 (DR1) and then 134125 (DR2). However a break below this pinbar will then expose EU to 131441 (DS1) , followed by 130718 (DS2) and then 129740 (DS3).
In regards to economic data, it was a week of mixed figures which included some following figures: German IFO Current Assessment (Aug) 112 vs. 110 Business Climate 107.5 vs. 107, Spanish GDP -1.6% vs. -1.7%, Consumer Confidence (Aug) -16 vv -16.5. However this was offset with poor results suchas German CPI (YoY) (Aug) 1.5% vs. 1.7% and German Harmonised Index of Consumer Prices (YoY) (Aug) 1.6% vs. 1.7%. This week will see the announcement of the interest rate decision by the ECB as well as their Monetary Policy Statement. Both events, holding great potential being the catalyst/s to move EU beyond its parameters.
In regards to economic data, it was a week of mixed figures which included some following figures: German IFO Current Assessment (Aug) 112 vs. 110 Business Climate 107.5 vs. 107, Spanish GDP -1.6% vs. -1.7%, Consumer Confidence (Aug) -16 vv -16.5. However this was offset with poor results suchas German CPI (YoY) (Aug) 1.5% vs. 1.7% and German Harmonised Index of Consumer Prices (YoY) (Aug) 1.6% vs. 1.7%. This week will see the announcement of the interest rate decision by the ECB as well as their Monetary Policy Statement. Both events, holding great potential being the catalyst/s to move EU beyond its parameters.
AUDUSD

Opening the week at 90328, AU also continued the consolidation formed after the late bullish breakout last week during the New York session. With an early attempt to test lower 90, AU first reached 90160 before bouncing back up to 90423 in the next three candles. However, upon rejection, AU then retreated back down to 90242 in the next candle followed by a further decline to 90067. Embarking back in familiar territory, the close approach of the 90 saw this level once again respected, sending AU immediately higher to 90695 with the next candle. However, this sudden bullish surge was once again short-lived with sellers poised towards the 91 resistance level, pushing AU back down to a low of 90182 before breaking lower to 90093.
A new wave of selling then stepped in upon re-visiting this area, printing a prominent bearish breakout candle (high of 90097 and low of 89764) that followed with a pause around 89632 (76%), eventually giving way to price while finding support around 89391 (DP). Forming a series of pinbars, AU then attempted to break higher, managing to reach a high of 89873 which unfortunately failed to hold but instead resulting in the formation of an inverted pinbar. This then followed with another attempt to follow through, which instead saw price drop to a low of 89399, closing the candle at 89640. However, quite determined, this paved the way for an attempt higher reaching 89959. This level met with rejection with which then saw AU proceed in a steady decline south, pausing once again at DP before breaking lower, to test near 89 at 89126.
Price then contined to consolidate around 89003 (DS1), touching a low of 88920, however, reluctant to follow through, AU instead reversed upon the re-visit to the 89 price level, displaying a surge of buying with the next candle (low of 88999 and high of 89456). This led to a further retracement higher, pausing first around DP and then through to 89632 (76%). However the 76% level remained well protected and upon breaching this level, saw sellers step in to resume the bearish trend, printing an inverted pinbar. However this rejected with the next candle which saw AU fail to follow through but reach higher to test 89780, the exact 100% level.
Now satisfied, AU reversed back lower first to 89212, which showed great effort to hold at this level, but prompted a further move down taking another shot at 89, reaching a low of 89011. Clear hesitation surrounded this new low which saw AU reverse sharply upon the formation of a pinbar at 89011. Once back at this level, AU moved in to a short consolidation before breaking back down to DS1 where AU settled in the last few hours of trade, closing at 88969.
The fact that AU ended the week around DR3 does lend probably cause to expecting some sort of retracement if not a nice fall from the high 80s and 90 region. However, price is finding its feet momentarily and unlike previous instances where we have seen a consistent fall from the top to the bottom, last week did show an effort to maintain its position around 90, which has been a significant level in recent weeks. Interestingly, price retracements have also aligned and reacted nicely with pre-established levels.
In regards to data, the week was once again quite light, although there were a couple of positive figures released including Private Capital Expenditure (Q2) which beat expectations 4.0% vs 0.2% and Private SectorCredit (YoY) showing an improvement from 3.1% to 2.2%. In the commodity markets, base metal prices showed an improvement sparked by a positive turn in economic news. Meanwhile, improvements in the Chinese economy have now pointed to early signs of stabilising, though this does not completely rule out the possibility of the economy experiencing further slowing down the track.
It is expected that the metal markets will be in surplus later in 2013, due to a reduction in demand. However, this will be impacted by any positive economic data released by the major economies. Tuesday brings into focus the interest rate decision to be announced by the RBA. This may be the catalyst to set AU on its path to continuation or correction. Should the rate remain unchanged, this may strengthen the possibility of a rate cut in Nov which currently is supported by speculation.
Moving back to the charts, following the break from top consolidation and the first instance of rejection presented on the 27th August, AU has kept movement contained between DS1 (under 89003) and 98780 (100%), which on the higher time frames shows AU in preparation for an extension lower to come.
Looking at the wider parameters for AU, 90368 (DS3) should cap AU from the top and moving below that 90008 (DR2). However, containment below 89418 (76%) will keep AU within a more immediate bearish view. In light of a continuation from current levels, 89072 (23%) should be the level to watch as possible resistance up to 89210. A rejection from this level will see AU target 88646 (DS1) followed by 88340 (DS2) and then 87788 (DR3). If AI breaks above top resistance upon market reaction to the pending Interest Rate decision, this will extend the correction further north.
USDJPY

Price movement for UJ was rather interesting last week. Opening the week at 98560, UJ commenced the week resuming in consolidation just above the previous 76% level between a range of 98555 and 98788 until the 27th August. Upon breaking lower, first support was found at 98262 (the new 76% level),giving way to a steep fall to a low of 96808. Finding support around 97008 (DS2), UJ retraced back to 97443 (previous day's low), where it paused briefly before continuing its journey north stopping next at 97696 (23%). UJ consolidated here for a little while longer before moving slightly higher to 97899 just breaching 97853 (38%), where another attempt to reverse lower was caught at upon price once again reaching the previous day's low.
The failure to follow through then led to a bullish charge that saw UJ break higher in 4 consecutive candles from a low of 97443 (previous day's low) to a high of 98187, just breaching DP. Resting here briefly UJ then broke higher reaching 98515 (previous day's high) where it stayed, re-testing this price level twice before retracing back to 76%. This saw momentary reluctance to break lower in the form of an attempt to protect the 76% level, however the print of an inverted pinbar within the range led to UJ gradually move towards DP and attempt a move south, leading to the formation of a lower wick upon touching 97878 (just above 38%). This rejection then led to UJ moving back towards 76% and containing itself within a range between DP and 76% (98097 - 98262), closing the New York session at 98147.
In regards to economic data, the US did produce some positive figures among the data released starting with the US Dallas Fed Manufacturing Business Index (Aug) beating expectations at 5 vs. 4 , while Consumer Confidence (Aug) also showed an improvement with 81.5 vs. 80.3. However, this did very little to inspire UJ at the beginning of week, which saw other events such as the situation in Syria take precedent in regards to focus. However, UJ soon saw a shift in direction with price moving away from DS2 low and back north. This was further supported by the surprising positive figure of 2.5% vs 1.1% that saved UJ from another attempt lower, boosting UJ back towards 76%. Japan's figures were also general positive with the Purchasing Manager Index 52.2 vs. 50, Industrial Production (YoY) (Jul) 1.6% vs. previous -4.6% and 7, National CPI (YoY) (Jul) 0.7% vs. previous 0.2%, however this failed to move the Yen significantly. Moving into September now also puts US tapering back in the spotlight with eyes on the USD.
Looking at the 4 hour chart, UJ closed the week sitting on DP, bringing the pair back into the range. So far, 95803 (WS2) which was reached on the 8th of August still stands as the low and until today still remains in place as support. On the other side of the coin, the 100 price point currently sits as top resistance within a short-term view. However, more interesting is the position of the current price which falls in alignment with the peak formation on the 15th August. So far UJ has not yet succeeded in falling from current levels and in favour of a more probable scenario of risk aversion combined with the upcoming US tapering, there is a chance that UJ may look to reject at a higher level. The daily chart still shows UJ caught in a consolidation which sees UJ taking a break from the prevailing uptrend. However a continuation would only be reflected upon a positive break above 100 followed by a re-test of the103 area. In the more immediate time frames, keeping parameters between 95 and 100 seem more realistic. That is, a target south upon a break of 98017 (23%) with the first target at 97414 (DS1), followed by 96963 (DS2), 96423 (DS3) and below that to 95897 (MS1) and then 95835 (WS2).
No comments:
Post a Comment