LiveForexTrading.info is pleased to provide you expert analysis and forecasting for the upcoming week from our resident analyst "Sharp Shooter"
Showing posts with label Section: Market Analysis. Show all posts

Monday, October 7, 2013

Market Analysis: WC 7 October 2013


Last week saw some strong movement among the majors with the Pound finally surrendering its position as the performance leader with its  declined from a top of 162595 down to 160 towards the end of the week.  This is of course, while playing "Freaky Friday" with the AUD, who stood as last week's winner, maintaining its resilient stance above its counterparts. This week poses as an important week for AUD, with the Unemployment Rate and Unemployment change due in the coming days. Most certainly, this could be the catalyst to push AU towards the direction of parity, where it currently seems poised  go, whilst holding above 94.  Looking at the other markets, the US indexes rose in the earlier part of the week while interestingly, the US debt situation has recently attracted the attention of  bargain investors taking advantage of current US stock prices.  With all eyes on the US as they continue with their deliberation, the financial markets remain on standby and ready to respond.


GPBUSD


GU opened the week at 161404, continuing the ascension in the previous NY session from a bottom of 160616 and reaching 161722 before pausing at current levels. This then led to a retracement  back to the open of 161404 in preparation for a continuation to the topside. Reaching a high of 162596, price consolidated around the highs for the next few hours which then saw GU move back to 161639. Finding support at 160, GU made another attempt back north reaching a high of 162507, which saw price maintain around 16219 (76% level) moving into the next trading session. This formed a  top consolidation, with price pausing briefly at  161743, before  breaking lower and finding refuge at 161539 (previous day’s low), as indecision set in, having broken through 162000. GU then proceeded lower towards 161187 (DS1), creating more ambitious targets as price continued its decline to 160970 (DS2) breaking the psychological 161 level and reaching a low of 160323. This tsaw price move back to 160779 and once again meet with rejection, sending GU back south with its sights set on 160323 (DS3). GU then proceeded to power through DS3, reaching a low of 160046, closing the NY session slightly higher at 160570.

The British Pound resumed the opposite side of the stage this week, having been the strongest performer last week to this week being the weakest performer, as poorer PMI figures provided the catalyst for profit taking and a move back to 160 by the end of Friday's NY session.  This followed the positive start to the week that saw an increase in Mortgage Approvals from 61.350k (forecast) to 62.226,  prompting the move higher to reaching a new top of 162596. However the bullish momentum was stumped with the release of  PMI figures on the 2nd and 3rd October, showing a  reduction in Manufacturing PMI from 57.2 to 56.7 (forecasted to improve  to 57.3) and a poorer Construction PMI figure which printed a weaker figure of of 58.9 vs. 59.1 (also forecasted to reflect an improvement of  59.2). In response, the Pound weakened across the board,  resulting in a sell off against all of its counterparts respectively.

Turning to the outlook of the British economy, the poor PMI figures were like a stone in its path as it halted the streak  of its most recent output of consistent positive data. Therefore, like the earlier GDP figure, this has not greatly impacted the current positive view of the British economy and the direction of its recovery. In other area of the economy,  the construction industry (as seen with previous PMI figures) has shown great a steady incline of growth, that has led to speculation for  GDP growth in the upcoming third quarter.  However, alongside this  as mentioned last week, are speculative concerns regarding a housing bubble given that the UK's housing sector has shown an increase of 0.5% from August, with housing prices higher by 2.4%. The month of August represented the highest issue of loans since February which is a positive.  In regards to this, Mark Carney has made a point of addressing the general public of their financial commitments in respect to affordability and the consideration of increasing  interest rates once the economy  has recovered to a suitable level.

Looking at the charts, GU created a double top at 162596 (Weekly high) with the first  summit to 162595 on the 1st  October and the  reversal carried out on the second rejection of the move to the top on the 2nd October. This was inspired by weaker  PMI  figures which shifted the momentum,  providing the catalyst to change directions, while promoting profit taking. With GU having advanced over 200 pips since the 24th September, a pullback or correction of some sort was imminent as the market looked to off load an accumulated stack of buy orders given the weaker domestic data and in light of the  looming debt ceiling which still holds much uncertainty. However as we enter a new week, hopes of a resolution roll into the next few days while  the US continue trying to resolve their issues.

This new week, GU  opens higher at 160454 under the 23% level (160454). With the BOE announcing their Interest Rate decision and any changes to their Asset Purchasing Facility program  on October 10, it is possible to see GU remaining subdued until the approach of critical date, which may be the  catalyst to instigate another major move in GU. A break above 160807 will see 161366 (76%) as the next test point which may contain GU  within its current downtrend. If this is the case, look for rejection and a move back through 160807 with support at 160454. However, if GU breaks above 161366, this may provide a long opportunity to re-test higher corrective levels. Above 161774, the next resistance level to watch is 163148. Continuing north from DP, the higher targets lie at: 161597, 163148 and 163956. Should price break through 160454, this will open GU to an extended fall to the following targets: 159237, 158480 and 156877.


EURUSD


EU opened the week around 40 pips lower than its NY close (just under 135) and remained range bound between (134803 and 135058) before breaking out higher with a bullish marubozu (low of 134938 and high of 135509).  From here,  EU created a higher base around 135270 before continuing higher as a bullish 3 candle step saw EU meet with the range top in preparation for another breakout. This then saw  sellers upon its approach to 136. Rejection was seen at 135867, pushing price down to 135434, where it stayed until descending lower to 135270. From here, EU then placed a target on 135 reaching a low of 135070 just above the round figure. Price consolidated here at the lows as it decided on its next move. This saw EU  break out back higher in a spectacular fashion, creating prominent bullish candle (low of 135041 and high of 135828) leading to a push higher and  breaking  above 136 as it reached  a high of 136066, before retreating back just under 136. 

Having tested 136, EU continued to consolidate around 135928 (23%) as it proceeded with a slow ascension north, reaching a high of 136458 which immediately met with rejection with the next candle. This saw price retreat back  below to the 76% level (136294), where it remained contained within a tight range  between 136156 and 136307 moving into the last day of the trading week. However the 23% level was only a resting point for EU, which after 5 hours saw EU finally break lower  through DS1 (135810) and  continue  down to  DS2 (135440) touching a low of  135379, before settling at the lows round 13553, closing the NY session at 135549.

In regards to events, the Monetary Policy Conference provided good insight into economic view held by the ECB, who highlighted that inflation still remained low, with  credit activity "subdued" and unemployment still sitting at a high level. As such the ECB  expect for Interest Rates being kept on hold for "an extended period of time" especially in light of  global economic conditions which as they stand, will not lend favourably to assisting with the improvement of timing for the eurozone economic recovery.   Also last week, developments  in the Italian political arena  saw Italy's Prime Minister Enrico Letta win the confidence vote, keeping his coalition in tact.

Short term money market still remain on "watch" for the  ECB,  who have stated that will be   prepared to do whatever is necessary to align  money market rates with price stability. Though this does not hold the same level of attentiveness for the appreciation of the Euro,  which the ECB acknowledges but does not put forward a priority concern. While economic growth is expected to  continue improving at a "slow pace", this means thatwe will unlikely see changes in monetary policy in the near future, though, this still does not rule out a rate cut if it necessary. But with rates t a low level, this not only  assists with money market rates but will also be more beneficial for its current position as it continues with its recovery amongst global uncertainty and lower global demand. This of course,  combined with managing its own internal problems in the areas of political, social and financial. One potential issue that has received some recognition is the state of the banking sector and its ties to  potential further bailouts, along with the  exhaustion of borrowing capacity by sovereign states.

When  looking at EU over a longer time period, we can see that the formation of a bull run from  the 5th September, instigated from a  low of 131040, leading to a higher consolidation area  around  the 13281 price point on the 12th September. Opening the next week around 60 pips higher, showed that USD weakness was still in action, giving EU the opportunity to continue its bull trend, which was further bolstered by the breakout  initiated on the 18th September  in response to the FOMC tapering announcement which s saw EU surge to a high of 135409. It is from this date, that we saw EU locked in a steady range type movement within the confinement of the lower to  mid 135 region. Only upon the ECB announcement of  maintaining rates on hold at 0.5%, did EU find the additional momentum to reach above 136 to a high of 136458 on Friday. Interestingly, when looking a price movement patterns, the recent breakdown from the high 136 area on Friday brought  price back in line with  DS2  (around 135549), aligns with the tops of the previous peaks formed throughout the month of September.  

The recent rise in EU  can be attributed to its response to the output of positive domestic data and recent events discussing the progressive developments in the Eurozone,  extending from the  optimism brought forward upon the earlier announcement of the Eurozone's "exit" from its recession. This of course being the key turning point for  the recent price movement in the EU. However a reality check may be pending upon comments made by the ECB indicating that  the Eurozone still has work to do and is not expecting a robust or change in its outlook in the near future, nor over improvements regarding the timing of its recovery. This is not only due to expectations and forecasts within the domestic economy  but also in consideration of the current  global environment which has no positive influence in encouraging a stronger or speedier recovery. This not only references  the US but also the  emerging markets.

In regards to my levels, a break above  135800 will see the first test of resistance at 136093. Another attempt above 136 cannot be ruled out if the US disappoint with developments in their own domestic affairs especially and a sudden bout of weakness takes over whilst anticipation over a resolution is expected to bring relief. However, I still see any movement north as corrective and favour an opportunity to short.  If EU does break above 136093, the first test will be 136194. Breaking above this will open up to a re-test of 136313, followed by 136870 and then 137290 (or around the 137 figure). Alternatively,  a break through  135800 (DP) will see 135599 (23%) as the next support level. A confirmed break through the 23% level, will promote further bearish momentum and expose the following levels:  135108, 134720 and 134050.


AUDUSD


AU opened the week at 93078, continuing on from the last NY session which closed at 93113. The start of the Asia session saw AU’s movement quite subdued, breaking through 93 first and reaching a low of 92802 before moving back higher in line with the open, where it ranged for half of the Asia session before breaking higher reach to test above 93 reaching a high of 93344. This then saw AU pull back slightly to 93110 in preparation for another attempt, reached a slightly higher mark at 93539. However the approach of this mid 93 area, saw sellers enter upon this second attempt, leading to steady decline  back to the open which prompted a further push south, penetrating 93 and reaching a low of 92875, just  7.3 pips from the previous low.  Closing the candle at 92960, this produced a potential bearish continuation but was rejected with the next candle, which saw buyers intervene at 92966,  shortly leading to a breakout and producing a bullish 3 candle move, taking AU above 94  to a  high of 94227. 

Creating top consolidation around this area, AU touched a new high of 94346, before breaking lower producing a bearish candle (high of 94259 and low of 93849), followed by a consolidation that continued into the next day. AU then broke lower from the range, falling from 94080 down to 93682, which followed through with a further decline reaching a low of 93370, where it found support. From here, AU began its travel back north, aligning back at the 23% level (93778) and continuing higher, meeting back in line with the previous range at 93920. This then saw price consolidate just under 94 for much of the day as it struggled to break the range in either direction. Moving into the 4th October, AU started to edge slightly higher, reaching the 76% level (94032) where price maintained briefly  before breaking higher, producing a break out candle  from 94001 with a high of 94234. This then paved the way for a continuation north to a high of 94471, followed by a small retracement to 94218 before a re-attempt higher saw AU meet with resistance at 94582, creating a double top  that led to a small retracement back to  DR2 where price finally settled with a final price of  94348.

No doubt that the RBA has been recognised for its commendable job in containing the impact of global conditions while addressing the internal factors that have contributed to the decline in the Australian economy.  This brings us back to 2008, when Australia was the first country to post out of a recession from the GFC – not that Australia was even truly in a recession - not in the sense that the other advanced countries were.  Though part of this can be attributed to temporary changes such as the  restructuring of the workforce as well other initiatives acted out by the RBA in preparation for a possible negative impact on the domestic economy. Once again, we have seen this action take hold as global uncertainty resurfaces, and  efforts are exerted to minimize any adverse effects that may ricochet from global uncertainty. However, even given the stronger disposition,  as the domestic  economy starts to show improvements,  much like the other advanced countries working towards economic growth and stability, the RBA will look not only at domestic performance but at the current global economic position as well.  

So far, previous cash rates have factored in the current global situation in an effort to offer a type of protection for the economy. This  level of caution will be adjusted  accordingly, however, this will be based upon  further reassurance in both areas, that will be factored into a building a case for the eventual raising of the cash rate. Expanding on this, the RBA see 2014 to hold more promise of improvements in both the global economic arena and domestic economy. This does lend to the idea of a possible rate rise to come in the future and Australia to be the first.

In regards to the outlook,  domestic growth is expected to  remain under par in the near term future  largely due to the decline in the mining sector, while a depreciating currency is still preferred, to assist with the economic recovery.  Earlier adjustments to monetary policy have been noted to be producing a positive outcome in the areas of investment and recent economic data such as the AIG Manufacturing PMI printing stronger figures for the first time in 2 years, along with improvements in retail sales, consumer confidence have contributed to a positive outlook for Australia. Taking this into consideration along with the view of a potential rate rise in 2014 has sparked recent buying interest in the AUD  and until today has seen AU stand defiantly towards the upper region of its recent price range.  However looking at things objectively and more "near-term", the RBA are not looking to make any move towards changes in monetary policy without the demonstration of further consistent economic data supporting stronger evidence of economic growth.  This is of course also taking into consideration the position of the global economy at that time as well.

Looking at AU on the daily chart, we can clearly see the pair in the midst of a correction, having broken above the top of 92955, which currently sees price now aligning with  the previous pullback in the long term downtrend. As such, this retracement does  present a nice top formation should price reject from current levels, however moving higher,  the mid 95  - 97  also sets up as a possible topping area.  Moving to the 4 hour chart, we see a completed bullish retracement back to the previous point of break instigating the fall from 94502 to a low of 92802. It is possible for AU to continue trading with the parameters set up on the 4 hour chart while on stand by  with US developments otherwise  this week does present the  potential for the currency pair to advance with support from the Unemployment Rate and Unemployment change due later this week. However, until then, it is likely to see AU either stay subdued at currently levels or sell off slightly prior to the announcement. Both figures are forecasted to produce a positive outcome (with the Unemployment rate unchanged), therefore,  pre-announcement  market sentiment looks in favour of AU long, seeking a top at the higher key levels for now. This of course can change if the US come to the table.

In regards to my levels,  a break above 94416 (76%)  will promote bullish momentum and bring the following targets into view:94706, 95097, 95629.  Alternatively, should a  break lower through 94178 (DP), will see 94043(23%) tested for support. Breaking this level will expose 93797, 93280 and then 92877. If AU does make a run for the 95 - 97 area, this would be a good candidate for a topping area.


USDJPY


UJ opened the week at 97639 having tested the bottom, and breaking out higher printing a bullish marabozu (low of 97653 and high of 98122)  that saw price push higher to 98315 where price consolidated before attempting to a move north reaching a high of 98720. This immediately met with rejection  with the next candle sending UJ all the way back to a low of  976365 where price found support.  From here, UJ then bounced back up from this level to a high of 98290 that followed with price maintaining its position around current levels contained within a range between 97749 – 98120 before  finally breaking lower on the 2nd October  to a low of  97137.

UJ then attempted a small bounce back to 97562   which then saw price retrace back to the 38% (97282). Holding as support, UJ then made another attempt to the topside reaching a high of 97863 that immediately rejected with the next candle, sending UJ declining from a high of 97863 to a low of 96923, breaking 23% (97145). Having pierced 97, UJ found support around this round number which then  followed price consolidating around the 23% before attempting a small rise, taking UJ above 50% level (97394) with a final close at 97448.

In the latest release issued by the BOJ, it was stated that Japan's  economy (3rd largest) is growing at a moderate pace. Recent data has also pointed to improvements in the domestic economy such as the rise in  CPI rose, along with other improvements such as business confidence and foreign investment. As such, the BOJ kept Interest Rates on hold at 0.1% last week, standing by the affirmation that the Japanese economy was indeed recovering and thus there was no further need to ease policy. In addition, this also saw the approval of the corporate  sales tax increase,  which earlier in the week, raised concerns over its impact on the appreciating Yen. However,  the BOJ have now moved forward with the decision to  go ahead as planned,  keeping in mind the 2% inflation target which will continue to be monitored. In regards to the global outlook, Japan is also closely monitoring the movements in the US as well as the emerging markets and exporting economies which may potentially have an impact on their own economy and their recovery.

Moving on to the US, all eyes are on the US shutdown which still continues to take the spotlight.  With October 17  approaching, there is anticipation for some sort of resolution or development to be announced in the coming days. Until then, UJ stands very weak while Yen continues  to act as a safe haven currency against the USD. Developments in the US or a favourable resolution will see this quickly change, but until then, it is likely to UJ contained within range until an appropriate catalyst is presented.  

Looking at the charts,  the 4 hour chart still shows movement within a downtrend. However with the daily still showing UJ locked within a range, it is very possible to see UJ  move north should the USD receive strength. This is a big week for US economic data which  includes last week's postponed NFP figure due out on Oct 11. Currently the 1 hour shows UJ sitting at DS1 which is also around the previous day's low at 96946. Movement between this level and 97390 would be a good range to intra day trade while UJ stays in the lower band of this price movement. Breaking above 97349 could see UJ move north towards 98, though I am weary of USD strength without a proper catalyst in place and see that any push higher may just result in price remaining contained while uncertainty looms.  Any surge among its counterparts will need to be inspired by domestic events, while the US deliberate over their Fiscal Budget. A bounce from the 23% level (97071) could produce a nice intraday 30 -40 pip return, while breaking lower,  will bring  targets within the 96 price range into view.

In regards to my levels,  with price at current levels, a break above  97474 will promote bullish momentum level, opening up to the following targets: 97865, 98353 and 98841. Alternatively, a break lower through 97387 (DP) will see the first test of support at 97071 at the 23% level (current position) with a break through this level exposing the following targets: 96928, 96454 and 960183


Want to keep up to date with our posts? We are now on Twitter. Follow @GFXTRADER and receive updates throughout the week.

Monday, September 30, 2013

Market Analysis: WC 30th Sept 2013


Once again, the market remained in risk mode this week, while weakness to the USD saw majors such as GU and EU make its way back to the highs. No doubt, that GU  was the best performer of the week, while AU benefited from the ride back to 94 where it met with resistance, taking the currency pair back to 93 by the end of the week. Meanwhile UJ managed to find some strength mid week making its way back over 99 (99104), only to decline back to 98 during Friday's trading session.   With the US government currently in the spotlight (and on a tight deadline to pass their federal budget by 30th Sept), timing is now of the essence, with a government shutdown potentially on the cards. However also in focus this week is the Non Farm Payroll Figure and the Interest Rate Decision for Australia, Europe, Japan and the US. We kick start with the  Australian RBA scheduled for tomorrow, Tuesday 1st October 2013. 


GPBUSD


GU opened the Asia session at a price of 160017, following on from last week’s NY close at 159949. Starting with a move north, GU steadily began its ascension to a high of 160719, where price maintained (between 160285 and 160728), before dropping lower on the 24th September in the form of a prominent bearish candle (high of 160273 and low of 159739).  Once the 160 level was broken,  GU paused briefly  before resuming its move lower, finding support at 159545 (DS2).  From here, GU  moved back towards 159906 (DS1), proceeding north and finding temporary resistance at 160217 (23%). With the 23% level now as a temporary ceiling, GU attempted another move lower, only managing to reach 159787, before buyers stepped in, taking GU back above 160403 (DP) and then further north to 150728 (78%). GU stayed around the 76% level for most of the trading session on the 25th September in clear indecision as its next move was contemplated.  This resulted in a break higher to 160956, which immediately faced rejection upon its approach to 161, sending price down in singular bearish candle (high of 159950 and low of  160348). Pausing briefly at DP, GU continued its move down, breaking DP, followed by the 23% level (160217), until finding support just under 160 at 159989.

Having re-tested the low of 160, GU reversed back to DP which once reached, prompted a major breakout upon a news headline, that saw price surge to a high of 161322, breaking above the psychological 161 level.  However, once reached, indecision set in,  resulting in a pull back upon profit taking, representing a bearish 3 candle move. Finding support around 150728 (78%), buyers stepped in taking  GU to a high of 161422, where GU closed the NY session.

Looking at GU at the start of the week, we can see price movement resuming from break of top resistance made on the 19th September from 161394. This saw GU break from 161394 to 160768 in a bearish marubozu that followed by a range type movement as price stayed contained between its effort to reach 160 but with its inability to sustain over 161.  As such, the high of 160710 made on the 23rd September aligns with the high of 160663 made on the 20th September, providing a type of ceiling, that followed with a gradual decline to a low of 159545 on the 24th September. When observing  movement on the 4 hour chart, we can see price intending  to resume lower, but changing direction as price breaks above 160 producing a bullish breakout candle (low of 159887 and high of 160594) in response to the positive data (Distributive Trades Survey figures exceeding expectations at 34 vs. forecasted 24).  This then brought price back towards 161,  but once again was unable to hold, thus proving the significance of this psychological ceiling, which led to  GU retreating back to the 160217 (23% level) touching a low of 159989. From this point, it was clear that upon settling in the lower region of 160, this now held a good possibility for GU to extend the move lower into the 159 region,  having already tested the mid 159 region twice.

However, the move was disrupted by a news headline quoting BOE Governor Mark as saying that “he did not see a need for more easing”.  This provided the catalyst for a direction change in favour of the bulls, who then proceeded to push price above the 161 level. Interestingly, GU met with resistance at the same level that it initially broke from (top consolidation) on the 19th September. However, more interesting is the reaction to this comment which overlooks the second portion of the statement which mentions that he would change his stance should “the economy falter”. This basically means that QE is still data dependent and while data remains positive, further QE is not necessary. However should inconsistency start to emerge in data figures, this may change the directive of the comment completely.

Since the introduction of forward policy, this has seen a rise in swap rates which have moved higher along with yields. It has always been questionable whether this would actually be addressed, given that high interest rates are not good for a recovering economy. As such, this then places focus on the asset purchasing facility, which for the last 3 votes has resulted in “no change” and a positive reaction in the market to follow. However, if high interest rates start to pose as a problem for the recovering economy, the BOE may start to consider increasing bond buying as an interim solution. 

Aside from this, lies other concerns within the British economy such as a potential new “housing bubble” as  Britain’s Prime Minister looks to move forward the second phase of an assistance program called “Help to Buy”. While the intention is sincere in its objective, there is general fear that while increasing housing debt, this may also inflate the property market which will provide the adverse outcome, placing home ownership further more out of reach for the average UK resident.


This then ties in with the domestic currency. Should the property market appreciate, alongside an appreciating currency, other problems will start to surface for the economy, given that the UK attracts foreign inflow brought in by  investors who look to buy into growth periods such as an asset or housing booms.  An appreciating currency will make assets more expensive and less appealing to foreign investors while a rise in assets will be detrimental for both foreign and domestic investment. In short, not a positive for the UK and not a positive for a recovering economy.


Moving back to the week’s events, the drop in GDP  saw GU aggressively sell back to the 160 level.  This does bring us back to reality that the reliance on a continual output of positive data may be over ambitious in expectation, as a negative result can reverse sentiment quickly.  This does also open the to the possibility that consecutive negative numbers could be enough to cause doubt and reverse current market sentiment. With this in mind, it is still wise to keep GU within its trading parameters as it continues on its steep incline, as this will surely meet with exhaustion should the move be too aggressive, too quickly. I do think there will be a pullback and a reassessment of direction however, whether this is before or after a move higher remains to be seen. With price currently around 161442, GU sits in a very delicate position with a possibility of surging higher towards 162 even to 163 should it maintain its position above 161. Unless backed by its own positive domestic figures, it is possible that we may see caution among the majors, until the release of their own domestic data  while also relying on the outcome of the  pending US situation. This may mean that price stays contained within its range for the meantime. 

In regards to my levels, a break above 161454 will then see 161904 come into view, followed by 162394 and then 163346. Even with current moment in favour of risk, there will be sellers at the higher key levels looking for opportunities to short GU back towards 160. Alternatively, a bearish scenario will need to see a break lower through 161100 (76%) followed by a break through 1160925 (DP) and then 160567(23%). Breaking through the 23% level, will expose: the following targets: 160407, 159456 and then 159000.


EURUSD


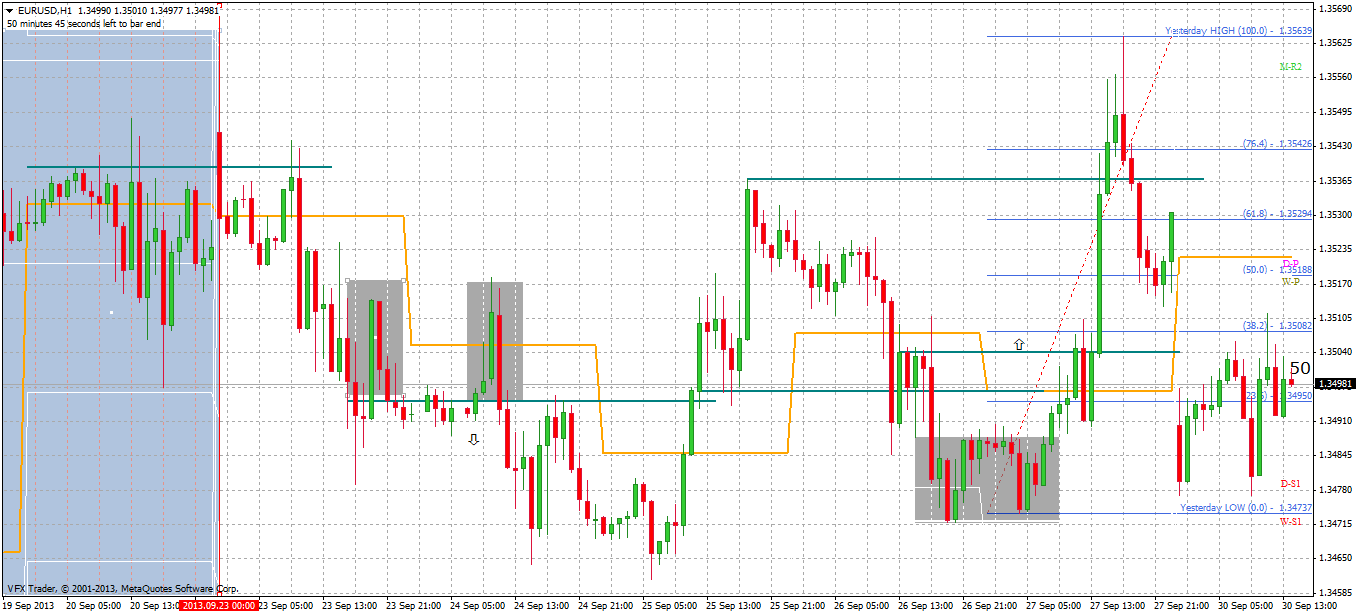
EU opened the week higher at 135457, maintaining its movement around current levels before a  rejection higher led to a push lower, taking EU from a high of 135426 to a low of 13578 in the form of a prominent bearish candle. This then followed by a steady move down, finding support upon reaching a low of 134790. Supported at DP, this inspired another bullish breakout printing a bullish marubozu (134913 and high of 135140) that saw price stop just under reaching the 76% level. Holding as momentary resistance, price then retraced back to DP, where it attempted to replicate the same move north, only to meet with the same fate upon resistance at the 76% level. Now, having met with double rejection, this opened the pathway for a further decline which saw EU break 135, reaching a low of  135639 on the 25th September. This then followed by a small bounce  back to 134850 (23%) which upon  providing minor resistance, saw GU once again retrace back lower towards DS1.

Unable to penetrate DS1, EU instead found buyers at this level who proceeded to push EU back above DP in 3 bullish candles back to the 76% level. Price paused here for a few hours, locked in a small consolidation, that then led to a breakout, reaching a high of 13568. This immediately followed by a consolidation between the high and 76% level, before proceeding to break lower on the 26th September. This saw GU first pause at DP, before resuming towards the 23% level, meeting back in line with the low of 134719. Still unable to break the low, EU once again found refuge at the 23% level where it consolidated in preparation for its next move.  Breaking from consolidation, EU reversed higher towards  DP, breaking the previous high at 135418 and pushing to 135639, forming an inverted pinbar. This followed with a retracement back to 135170 (76%) and price closing the session slightly higher at 135306.

Looking at charts, EU has engaged in a steady decline from the commencement of the week until the discovery of support at 134639 on the 25th September. This instigated a bullish reversal from the support level within the preceding downtrend. Referring to the 4 hour chart, a breakout candle (low of 134660 and high of 13494) can be seen, taking EU back to DP and then to a high of  135558 on a spurt of bullish momentum. When assessing this particular move on a smaller time frame such as a one hour chart, the breakout candle forms the first candle of a 3 candle bullish formation reaching a target of DR2 (135538) but achieving a high of 135639 post the release of the Reuters/Michigan Consumer Sentiment Index which fell slightly short of the 78 forecasted figure at 77.5. This then saw EU move higher piercing through MR2 and meeting with the previous high of 135678 made on the 19th September.

Although there was not much in the way of economic data to inspire this move, it does align in timing with a speech delivered by Joaquín Almunia (Vice President of the European Commission) in Washington DC on the 25th September. This follows with an announcement of the decision to grant authority to the ECB to supervise 6000 banks within 17 European countries on the 26th September in line with the new Banking Union. The appointment will see the ECB take its role as the supervisor in 2014 and forms part of a 3 stage process for the new Banking Union introduced in June 2012, comprising of 3 components: 1) Single Bank Supervisor  2) Single Resolution Authority   3) Single Depository.   This system will  endevour to address and  improve the problems of the former European banking system in an effort to achieve financial stability.

With the ECB due to announce the next Interest Rate decision, it is generally expected that rates will remain on hold at 0.5% while the ECB continues to use the low rate to  assist the short-term money market rate. However, although this may the case for now, it does not rule out the possibility for further cuts in the future. Much like all the recovering economies, it is not practical to commit to such decisions without firmer evidence of stability. Though the rise  in the interbank rate (in reference to the “interbank market”) has been largely due to the recent rise in US yields combined with the output of positive economic data. As such a high rate is not sustainable in current economic conditions and the ECB have confirmed that although there are no targets for money market rates, the ECB does have the  “tools” to bring the rates down.

In regards to my levels, a move higher from 135220 (DP)  will see 135426 (76%) tested for resistance. If this level breaks higher, this will then see 135639 (previous day high) tested and breaking higher from here will open the following targets: 135710, 136123 and 136634. Alternatively,  a break through  135220(DP) will see 134950 (23%) as the next support level. A confirmed break through the 23% level, will promote further bearish momentum and expose the following levels:  134800, 134287 and 133874.


AUDUSD


AU commenced the week lower than its NY close, opening the Asia session at  93678 from its NY close 93912. However,  only managing to move a few pips lower to 93621, AU instead broke higher, pausing around 93866 (76%) before breaking out in a prominent bullish candle (low of 93814 and high of 94372). Price maintained its momentum above 94 (94207) before moving north, reaching a high of 94545, which upon approach met with rejection sending price back in line  with 94207 before making its move back to 93866 (76%). This saw price then make its way back towards 94, where it rejected upon reaching 94189, declining to a low of 93731. However, unable to follow through, price instead re-attempted a move back to 94, once again meeting with rejection as sellers poised at this key level contained higher price movement. A second rejection then prompted the move lower, which saw AU make another move south reaching a low of 93379 (DS1).  Finding support at this level, AU then bounced back towards 93866 (76%) which acted as resistance, sending it back to DP where it consolidated briefly before moving lower to 93466 (23%).

Now supported at the 23%, AU made a bullish move back to 94, reaching a high of  94008. Sellers then intervened once more pushing price back to the 76% level, where it paused before breaking down back to DP and  through the 23% level,  meeting back in line with the low made on the 25th September with its current new low at 93379. Still unable break through, AU moved back to DP, which then became new resistance as price rejected accordingly producing a prominent bearish candle (high of  93744 and low of 93400). Upon its first test of this fall, AU found support taking price back to DP. However, the retracement back to this pivot level, signaled another sell with price breaking through the previous day low (93398) , finding support at 93000. AU closed the NY session positioned at the lows with a final price of 93113 (around DS2).

Supporting domestic data was fairly light for AUD, which meant that it had very little support to hold itself up in regards to  positive figures or support  from its correlation with other financial markets. AUD has done very well most recently,  reaching higher corrective points between 94 -95 upon weakness in the USD. The 95 level was always a key area to watch, that if price could sustain around this area, held the possibility of promoting another boost towards the direction of parity despite its own prevailing weakness. With the announcement of the next Interest Rate decision due tomorrow,  the position of the AUD will be closely observed as many look to its position for any type of indication as to whether the RBA may feel  another cut is warranted. So far, the RBA still supports a weaker currency and as mentioned last week, there is no certainty or indication leaning towards a further cut while the RBA believes that all factors contributing to meeting its economic objectives are still intact. While the AUD remains weak, this effectively serves its purpose in fulfilling its current role in adding stimulus to the domestic economy.

When looking at the 4 hour chart, it shows a continuation from the top of 95281 formed on the 18th September after the FOMC announcement representing an exaggerated bullish candle (low of 93612 and high of 95281) that immediately sold off with the next 4 hour candle.  Given that price closed at a key support level, it is possible that we may see a retracement high before resuming lower. In light of the pending outcome for the US Debt Ceiling situation currently  looming over financial markets, with its threat to initiate a "government shutdown", AU will react accordingly in the event that the markets turn in favour of risk. Though performance wise, the AUD has started to slacken as key events draw closer and the charts show no sign of a bottom as yet. Should the currency find the drive to head back south, this will bring back 91 into view.

In regards to my levels, a break above  93340 (DP) will see AU test 93561 (76%). Moving north from this level will then see AU extend its retracement, opening the following targets: 93760 , followed by 94410 and then 94800. Alternatively,  a break through 93340 (DP)   will then see the next support level at 93152 (23%). A break through the 23% level will  promote bearish momentum exposing the following levels: 92695, 92303 and 91654. 


USDJPY


UJ commenced the week, resuming within the price movement from the last session. Opening at 99241,  it was a steady decline to 98787 (DP), reaching a low of 98642 just above the 38% level, which upon holding support, pushed UJ back to the 76% level where it found resistance. This then saw UJ make another move lower to 98655, where it found support, creating a double bottom. From here, UJ then reversed north, breaking 76% and reaching a high of 99167. This followed shortly by a breakdown in the form of a bearish marubozu (high of 99109 and low of  98768) that extended lower reaching 98501 and then 98467 , forming a bullish pinbar. From here, price moved higher with another effort to break above 76% level, reaching a high of 98999. However upon this second re-test, price steadily fell moving into the 25th September, making a new low of 98378, which formed  a row of pinbars around 98465 (23% level). This gave UJ a little push back to 98810, (around the DP level), which immediately rejected, taking UJ back to the 23% level, forming a new low at 98260. Upon approach to 98, buyers then intervened, reversing the direction within two candles (low of 98372 to a high of 99104), meeting in line with the top of 99167 made on the 23rd September.

Price maintained around the 76% level (wedged between DP and 76%), before breaking lower from 98980 through the 50% level (98694). This then saw price make its way to the 23% level at 98500 where support was found, in the form of a pinbar. This then boosted UJ back to resistance at the 76% level, trying to break above 99, but price remained contained. Shortly after, a sell back to DP, inspired one more attempt higher, however, this met with the same outcome and  resistance clearly in place just above 99. The reluctance of buyers to push price above 99 instead saw UJ retreat from the highs declining back to the lows, touching 98090 and closing NY at 98227.

There was very little support in seeing a rise in UJ last week which was burdened with strength in the Yen and weakness in the USD. The rise in Japan's CPI took the spotlight last week, which saw a rise from 0.7% to 0.9%, beating the forecasted 0.8%. The improvement clearly pointing positively towards Japan's recovery strategy. However, although a positive, the appreciation in the Yen also translates into higher export prices, acting as a negative for the domestic economy, given its heavy reliance on exportation.   This follows earlier news of Japan considering to cut corporate tax, leading to a rise in the Nikkei and the Yen during the Asia session. Since then, a further comment was issued by Japan’s Finance Minister, stating that they may no longer proceed with the cuts to corporate tax in light of the boost it has given to the Yen. For UJ, the pair was given a double dose of weakness upon strength in the Yen and aversion to the USD upon the current US debt concerns as the Yen resumes its place as a safe haven currency against the USD.

This week sees a focus on the US and the outcome of the debt ceiling issue that may prompt a government shutdown. We also have the NFP figure due out on Friday (should the US till continue to be release data figures this week). There is a possibility that we may see the majors against the USD fall upon a positive NFP figure (which is the current forecast). However, underneath the movement in the financial markets, sits the tension between the US government parties which continues to build up while a  resolution or agreement has not been made, pointing to the possibility of a government shutdown becoming a reality. However, this is not the first time the US has faced this crisis, with the last event in 2011 resulting in a last minute resolution. In the charts, this showed a small rise in the majors against the USD just before the deadline and upon the resolution a drop of over 100 pips upon immediate strength to the USD. Whether this repeats the same behavioural pattern remains to be seen. However, there is speculation that the US stock markets will drop in response to the crisis within the new trading week. Given the shift in correlation between the USD and the US stock market, it is also likely that the USD will follow based upon recent trends. 

Looking back at last year, the USD had an adverse correlation to the US stocks which meant that sales in US equities were offset with purchasing the US currency. It does appear that the USD is re-aligning back with risk and if this is the case, then should the USD  remain without the assistance of domestic data and within the absence of a resolution to the debt ceiling situation, it is more than likely to maintain its weak position. 

Moving to the charts, it was a weak finish for UJ, ending  the NY session positioned under DS1 (98420). Looking at the 4 hour chart, it does appear that there is still room for the pair to travel further south with the last bottom of 96808 printed on the 28th August and more recently a low of 97755 which found support, pushing the pair back above 99 to a high of 99662. However with price settled around a key support level, this may see a price range or retrace a little higher first. When looking at UJ  on the daily chart, UJ is still nestled well within range with room to move in either direction. Though the current bias for the pair does point in a bearish direction for now, any retracement may see containment around the 99 level, possibly around the previous day's high of 99128.

In regards to my levels, a break above 9903 will promote bullish momentum level which will see the following targets come into view: 999475, followed by 99885 and then the psychological 100000 level. Alternatively, a break lower through 98465(DP) will expose the following levels: 97400, 96790 and then 96454.


Want to keep up to date with our posts? We are now on Twitter! Follow @GFXTRADER and receive updates throughout the week.  


Monday, September 23, 2013

Market Analysis: WC 23 Sept 2013


Last week saw the majors rise sharply against the USD upon the US Fed surprising the markets with their decision to hold tapering in favour stronger economic data figures to support economic growth. The announcement saw US stocks rise with the S&P reaching new highs, whilst in the commodities markets, Gold prices also rose in response. Turning to the FX markets, majors against the USD surged  between 100 - 250 pips  post announcement, closing the week at the highs. Upon improvements in the Euro zone, the Euro along with yields saw higher levels, while the dollar index  (DXY) rose 0.1%, finding support after economic data released  post the FOMC announcement. This week sees a few important data figures among the release of figures over the coming days. This includes: CPI (Euro),  GDP (Pound and Ye)n and Consumer Confidence (US). ECB President Mario Draghi is also scheduled to deliver a couple of speeches this week as well.


GPBUSD


GU commenced the week with determination, opening at 15933, over 100 pips high than the last NY close. However, it was a slow start, as indecision set in over the course of the next few days with GU trapped in a tight consolidation between 159640 and 159175, resuming lower  towards 158861 (capped by 159175) on the 17th September. It was not until mid week that GU finally broke out, pushing higher to 159628, providing a signal that the market had now decided on a direction. From here, price continued to range at current levels in preparation for its next move which led to a prominent bullish marubozu (low of 159755 and high of 161120). The ascension continued higher within the next two candles, reaching a high of 161622 (76%) before meeting with resistance.

Now having broken through 160 and surging straight to 161, GU continued to maintain its position at the highs moving into the 19th September, before sellers stepped in upon profit taking. This saw GU move back to 160768 and proceed to range around current levels (38%), before descending a little lower to  160218, moving with indecision between a tight range (160162 and 160194). The 20th September saw a small attempt north, reaching 160663, but this was immediately met with rejection as sellers pushed price back to 160372 and then further  to a low of 159858 just above DS1). This held as support taking price back just over 160 where price stayed until the end of the NY session, closing at 160013.

The surge in the Pound can been largely contributed not only to the FOMC announcement but to the tone of the Monetary Policy Minutes released on Tuesday which indicated that recent economic data pointed to an improvement in the UK economy and the data figures being described as "consistently stronger than market expectations".  As such, forecasts were revised to 0.7% higher from 0.5% (August), based upon the latest economic data, which also saw a move in government bonds above 3%. As a result, the positive turn in the outlook for the British economy prompted the BOE to present a less dovish tone and led to the decision last week to keep asset purchases unchanged at GBP375bn for the meantime with no change to the current interest rate of 0.5%. This was in view of the three "knockout" conditions: Inflation to be contained by 2.5% within the next 24 month period, observation to continue  over the indicators tied to inflation expectations and the assessment of monetary policy  and its relationship to financial stability. Other data figures released earlier in the week include: Core CPI (YoY) (Aug) which remained unchanged at 2.0% (under the forecast of 2.1%), CPI YoY (Aug) which met the forecast at 2.7%, but was still slightly lower than the previous figure 2.8%, and PPI Core Output (Aug) which came in under par at 1.0% vs. 1.1%.  

Taking a look at the 4 hour chart, we can see the start of GU confirming its bullish move on the 3rd September once breaking above 155991. This placed the next target at 157200 which when demonstrating its inability to hold as resistance, saw price move further north, continuing its ascension higher until reaching 158841. This then met with hesitation upon the approach of the 159 level. In the following week, the bullish trend continued, with GU opening higher with hesitation leading up to the FOMC announcement due on Wednesday the 18th September. As can be seen towards the close of the last NY session, once reaching the high of 161500, GU proceeded to fade back to 160031.

With price currently suspended above 160, this holds favourably towards the possibility for another  attempt higher upon breaking above 160460. Although recent price action has seen GU retrace and cover much of the bullish breakout from 159646 as price currently sits under DP. However as GU starts to makes its way back to the upside,  confirmation of  a bullish continuation will be seen upon both a break above 160473 and 160663, with price supported above these levels. Should this be the case, the following levels will then come into view: 161033 (DR1),  162073  (DR2) and 162710 (DR3). However should price fall below 160460 (DP),  160048 (23%) will be the next level tested as support. A break through this level will expose the following targets: 159381 (DS1), 158798 (DS2) and finally 157780 (DS3).


EURUSD


EU opened the week at 133594, over 60 pips higher from the last NY close (132180). Following in the same manner as the Pound, it was very uneventful leading up to the 18th September, when  the US Fed were due to make their announcements. While uncertainty remained, EU remained locked in a tight consolidation between 1333428 -133841, moving lower to a bottom of 133257, which kept price contained within a tight range.  Upon finding support, EU then re-aligned back with the 133400 range, still maintaining an extremely restricted range of just over 20 pips (top of 133656).  It was not until the 18th Sept, following the US Fed announcement, that we saw EU break with a surge of power, reacting strongly to the US Fed announcement that tapering would not commence in September as anticipated. It was an impressive move of over 140 pips upon a weaker USD, printing a prominent bullish marubozu (low of 13366 and high of 135096). This took EU to new highs that saw price maintain its bullish disposition locked at the top in a range (between 135114 – 135650) until the end of the week, closing the NY session at 135165 (23%).

As per the economic calendar, ECB President, Mario Draghi delivered a speech on the 16th September, which as expected, provided the ECB's assessment of the Euro zone's current economic condition. In this speech, Mario Draghi confirmed what much of the market already knew, which is that the euro zone’s economy was still in the early stages of its recovery. As such, in line with the other advanced countries also focused on their recovery, economic data will continue to play a key role in demonstrating improvements in economic growth, while assisting with determining the suitable timing to adjust monetary policy. However, the ECB like the US Fed, still require further evidence of improvement and as such, the ECB continue to  hold the view that the euro zone economy as whole is still considered “fragile”. Therefore, economic indicators such as unemployment still need to show significant progress especially in light of inflation expectations which are  expected to deliver a moderate performance in the near future. Even as the euro zone start to show improvements in data, the recovery is still considered progressive.

Currently the ECB have no immediate or short-term view to adjust interest rates despite the positive reflection in recent data indicating a transition away from the bottom. This also ties in with Draghi’s commitment to keep borrowing costs low. Therefore, while no significant action is on the horizon regarding adjustments to monetary policy, the positive is, that is there is a focus on the people and the economy has moved away from the "flashing red lights" once signalling warning bells for the potential break up of the Euro. They are now able to temper the likelihood of another major event, involving another scenario of bailouts and intervention from the IMF as seen in 2012. 

However, looking at economic data, this week saw inflation reducing  from 1.6% to 1.3% meeting expectations in August, while GDP figures were positive at 0.3% from -0.2% (1st quarter). This GDP figure represents the first sign of improvement after a succession of contracting quarters seen earlier in the year. However, with inflation still below the 2% target, this indicator still remains closely on watch. Looking more broadly at the macro picture, optimism has been very much influenced by the expansion in the euro zone economy recorded in June, which saw small improvements in pockets of economic data, supported by the unemployment rate, that despite difficulties in the economy, has still managed to stay consistent over the last few months.  In regards to other data figures, this includes: labour costs which were up 0.9% from 1.7%, along with the ZEW Economic Sentiment (Sept) reflecting an improvement at from 47.2 to 58.6. Currently in the  spotlight are the German elections which have Angela Merkel, the  current German Chancellor, tipped to be appointed into a third term in office. Germany goes to polls today (Sunday).

When looking at EU on the larger times, we can see EU  now positioned near the high of  137104 made on the 1st Feb, which to date has held as top resistance that has led to a steady decline down to  128 in April this year. The 128 level still holds as main support, keeping EU range bound on the higher times frames with room to move to the topside, as the 136 area comes into view (DR3).  Unless prompted by a major catalyst, 137 still holds as top resistance with this level possibly targeted as for re-testing, should EU push through 136. Given the bullish momentum surrounding the Euro, it is very possible that any positive release in data may trigger the completion of this move. However, while at the top end of the price range, I would be looking closely at economic events and movements not only in the FX markets but the other financial markets, as this may also possibly inspire a move in the Euro. 

While there is positives in data, a lot of uncertainty still holds not economically, but also politically and socially.  So while this is being ignored, any major movement in these areas may also trigger a move in the Euro.  As the ECB president has confirmed and as we know, the euro zone is still dealing with a lot of internal issues within some of their European countries (see last week's report).  Combine this with the situation in Syria and movements in the US, a trigger for top resistance can be found in many sources. Therefore, any type of rejection from these high levels, may bring EU back to 132-133 rather quickly. It will be a nice break but still well within range.  With price consolidating at the highs, a breakout is imminent and once direction is confirmed, a follow through to the next key levels will most  likely occur with price seeking  refuge in preparation for its next move.

In regards to levels,  a break above  135363 will promote bullish momentum level which will first test 135483 (previous day's high). Moving north from this level will place the following levels into view:  135980 (DR2), 136247 (DR3) and then 136642 as the next target.  Alternatively,  a break through  135270 (DP) will see 135095 (23%) as the next support level. A confirmed break through the 23% level, will promote further bearish momentum and expose the following levels:  134821(DS1), 134546 (DS2) and finally 134160 (DS3). 


AUDUSD


Like the other majors against the USD, AU started the week in positive form, opening at 93277, just over 70 pips higher than NY’s close at 92413. AU started the Asia session maintaining at current levels, moving slightly higher and reaching 93865, before hesitation towards 94 saw price pullback as sellers stepped in, pushing AU down to a low of 93166, with consistent selling over the next 4 hours. From here, price then settled around 94370 before drifting towards 94496 (23%) moving into the last day of trading. With price now sitting at the 23% level, the 20th Sept saw price break this level from 94530 to 94225, placing DS1 (9398) as the next target as AU created a low of 93770. Price quickly moved back over 94 and proceeded north with the next 3 candles, reaching 94311, which rejected sending price back down to 93763, closing the NY session at just under 94 at 93912.

According to the RBA meting notes released on the 17th September, exports have been the main support for the domestic economy with Iron-ore demand growing in the June quarter along with coal. As such, higher commodity prices have played a part in assisting the resource sector most recently. In other areas, retail sales and household consumption, reflected a mediocre performance, suggesting a level of conservative spending in the domestic economy in response to current economic conditions. On a positive note, the effects of low interests have had a stimulating effect on the housing sector as expected, along with building approvals showing an improvement in July. Shifting to employment, it has been noted that more recent figures have not reflected a significant improvement in relation to an expansion in population, which also saw a rise in the unemployment rate (last figure 5.8%).

In regards to GDP, figures have shown this to be performing below trend with expectations and this is to continue coming into the next few months. Alongside this is the expectation that mining investment will also start to decline over the next few years due to the completion of current projects. However, exportation is still seen to maintain its growth pace into the future.  This is not the case with non-mining industries which fall secondary to the resource sector and are foreseen to continue with their struggle in current economic conditions. With the RBA indicating that there are no definitive plans to further cut rates in the near future, it does suggest that October is leaning more to an unchanged rate, stumping earlier speculation of further cuts in the next round of cash rate announcements. Therefore, this view will be now be re-assessed for November.

Though this will of course be dependent on the position of the domestic currency, which as mentioned  previously, continues to play its role in “re-balancing” the domestic economy. Therefore, a further depreciation is still very much welcomed by the RBA while it continues to assist with providing stimulus to the economy.  On the other hand,  an appreciation of the AUD,  or – the AUD maintaining its position at the higher spectrum of its range, may see the RBA take more consideration towards once again adjusting interest rates, should the AUD move away from providing the positive effects derived from a depreciating dollar.

With AU currently sitting at the 23% level, a move from this position will determine the immediate direction. A break above  94273 will instigate a bullish attempt with the first test level at 94386.If AU manages to break 94386, this may signal a potential long trade while price is able to maintain above board. Moving north from this level will then place the following targets into view: 94824(DR1) followed by 95752 (DR2) and then 96299 (DR3). Breaking higher from DR3 will bring forward 96450 as the next target.

Alternatively,  a break through 94300 (DP)   will then see the next support level sitting at 93955 (23%). A break through the 23% level will  promote bearish momentum exposing the following levels: 93370 (DS1),  92811 (DS2) and 91865 (DS3). In the absence of any major domestic catalysts, keep on the look out for movement in the USD, CNY and commodities market. Also any sudden developments in the Syria crisis may also prompt a  move should risk aversion set in amid concerns and fears over possible outcomes.


USDJPY


Taking the opposite side of its counterparts, UJ opened the Asia session lower at 98689 from its previous NY close 99354. Movement remained steady between a range of 98653 – 99129, before moving back north on the 17th Sept, aligning with last week’s close. UJ continued to consolidate in a tight range  between 99129 – 99337 until the FOMC announcement due at the beginning of the  NY session on the 18th Sept. Following the Fed announcement, UJ immediately dropped over 90 pips in response and then further to a low of 97755, where it found support. From here, UJ then reversed sharply back north  to 99210 (76%), settling back around 99375.  UJ continued to range at current levels moving into the last day of trading, which saw very little movement as price remained suspended at the highs, retracing back to the 76% level (99210), closing the NY session at 99217.

As mentioned previously, Japan sits in a very unique position to the rest of the world as an economy heavily reliant on exportation to sustain their economy. It has most certainly been a road to recovery for Japan who have spent  much time addressing the issue of “deflation” over the last 15 years while most recently working towards achieving their 2% target announced earlier in the year. According to the latest speech given by the BOJ Governor Kuroda, Japan is progressing “smoothly” towards their objective and is recovering “moderately”. GDP figures for April-June have reflected growth, while machine orders (which for Japan is a leading indicator for business fixed investment) also saw an improvement emerging from a stagnation over the last 5 quarters. Other indicators such as an increase in consumer confidence has also  been supported by improvements in wages and employment.

The BOJ have emphasized that they will continue with QQE as long as necessarily in line with focusing on their  2% target and managing their long term  issues with deflation. Last week saw another round of positive economic data emerge from Japan with the Merchandise Trade Balance coming in at ¥960.3B vs. ¥1,100.8, the All Industry Activity Index showing an improvement at 0.5% vs. 0.4% and the Leading Economic Index which was higher at 107.9 vs. 107.3.

The US Fed provided the event of the week with all eyes on Bernanke and the announcement that had been the focus of the month as market participants awaited the news that the US would commence tapering their stimulus in September. It was a heavily anticipated event, that saw the majors engaged in a tight consolidation leading up the hour of the announcement.  Given the constraint of the range, there was no doubt that a major breakout was imminent. The only twist being that the outcome was largely in favour of a swing towards the USD upon expectations that the US Fed would commence tapering in September, which they announced is not the plan. Apart from this, there are now other concerns circulating around the US economy over the federal budget, borrowing limits and fiscal consolidation. Also, October marks the month that the treasury is expected to its exhaust borrowing capability upon reaching its statuary debt limit. 

With the view on tapering, this is certainly not off the table, but will be re-assessed in line with further signs of economic growth before the Fed look to adjust stimulus. With the major economies in recovery mode, there is a reluctance to make any bold or predictive moves without the support of stronger economic data to inspire the appropriate timing to take action.

Moving to the charts and starting with the Daily, we are seeing UJ start to slow its pace from its steep bullish climb from September 2012.  Looking at July, there is a potential head and shoulders pattern formed upon UJ moving back to the 94 level, however, this was quickly rejected, resulting in a continuation of the range instead. So far the 100 level still holds a strong psychological level that will continue to attract short attempts upon approach. However, once broken to the topside, UJ will look towards 101 and 102 once again. Upon strong bullish momentum, the 103 area still  holds as a top re-testing area that may or may not instigate a major rally upon it reach. 

Still on the higher time frames, breaking above 103675, will see UJ promote a continuation of its bullish run whilst rejection around this area, will see UJ retreat accordingly with a  lot of room south for UJ to travel down, while  staying within the confinement of its range. The 94 level will need to be broken in order to accelerate a bearish move, while movement above 103 will place UJ in view of higher targets. As such, this may hold as a possible scenario, should the USD find strength. In regards to the Yen, there will be very little opposition from the Yen who favour a lower currency in order to support their export market.  If anything, it is normally in the case of  Yen appreciation that has seen the BOJ intervened.

In regards to levels, I am looking at 99545 as a level to promote a bullish move while a break to 98915 will see UJ attempt support lower. Breaking above 99545, will first test  99662(previous day's high) and moving north from this level will place the following levels into view:  99940 (DR1) followed by 100687 (DR2) and then 100785(MR2). Breaking higher from MR2 will then bring 101758 (DR3) into view. Alternatively, a break through 98915 (DP) will expose the following levels: 98106 (DS1), then 97120 (DS2) and finally 96355 (DS3).


Want to keep up to date with our posts? We are now on Twitter! Follow @GFXTRADER and be the first to know :)